GridObserver® OPERATIONS

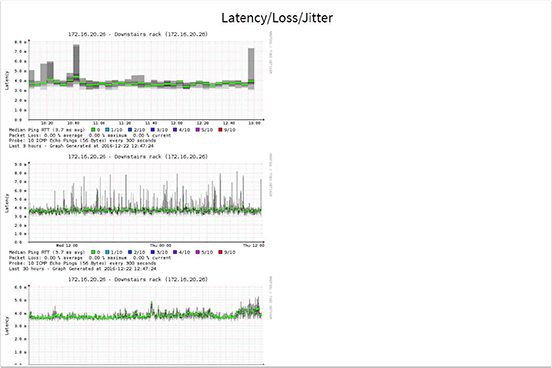
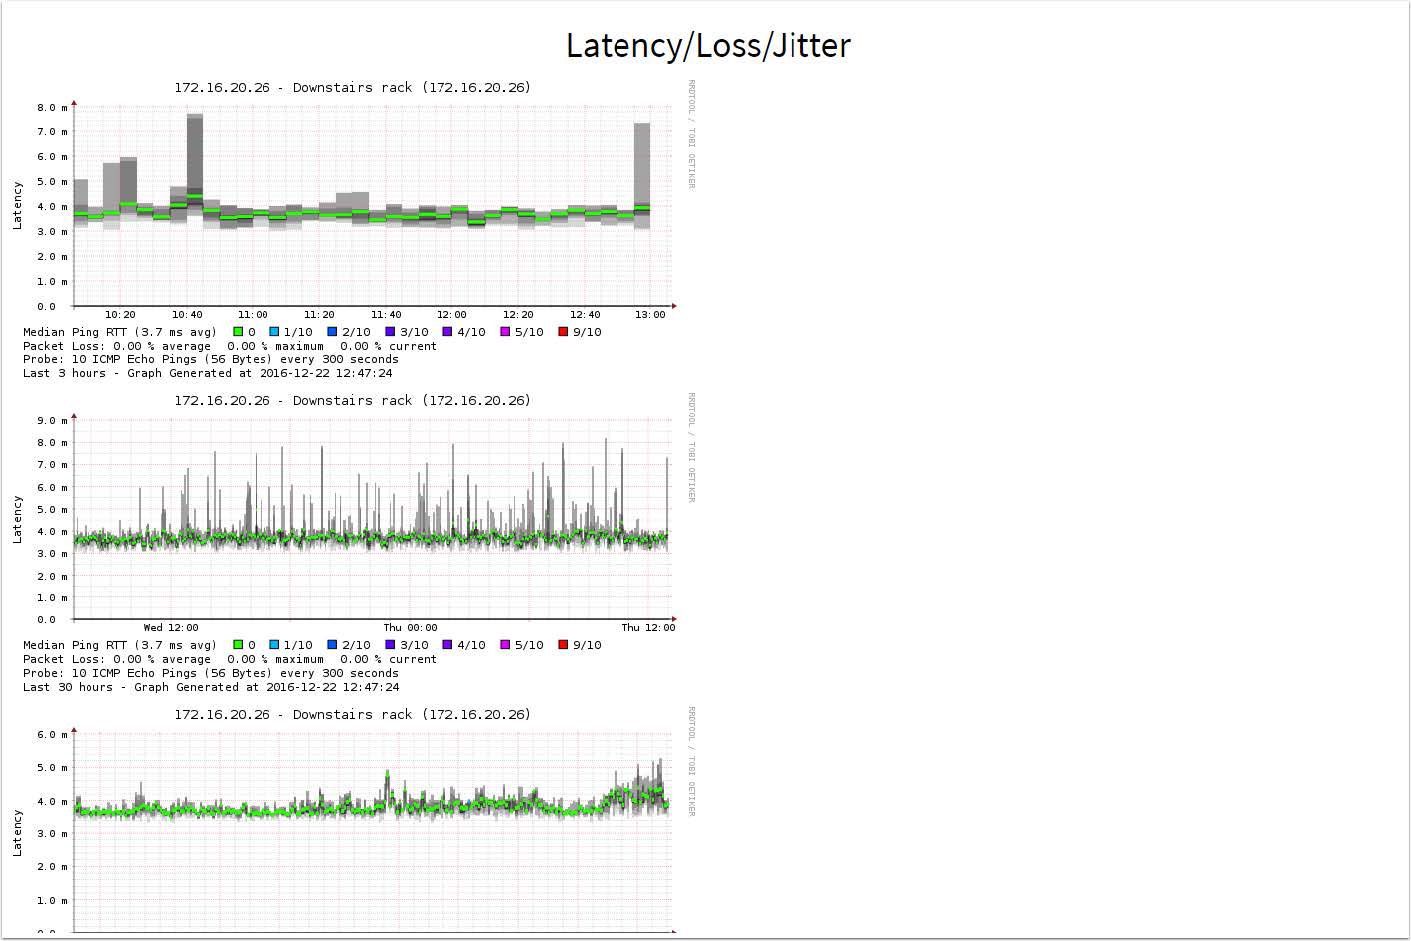
Click for larger image.
GridObserver® includes rapid integration technology such as the GridObserver® patent-pending Management Information Base (MIB) Browser tools and network discovery tools enabling the system to be up and running in a relatively short time. Thus, valuable information can be collected and provided within days of installation. The GridObserver® management platform appliance is installed in the network, and following initial configuration and setup, it’s ready to go!
GridObserver® has a broad range of standard reports imbues the system with the additional ability to easily create on-the-fly and recurring custom reports. The platform supports reporting on over 47,000 standard and vendor proprietary tables, as well as an additional 67,000 non-table parameters.
GridObserver® is easy to install. Many network monitoring systems are never fully deployed because of the difficulty and time involved with installation and integration. With GridObserver®, that never happens. It is all web based, and there are no external clients or agents. It ships as a fully configured appliance, which includes an auto discovery feature that does the majority of the configuration and detection work during the initial setup phase. Devices on a network using GridObserver® aren’t solely classified by manufacturer and model only, but also by the role they play in the network. This detection of their role in the network is made possible by GridObserver®’s ability to map virtual and physical connections within the network. GridObserver® recognizes the different roles devices play in the network and, as a result, it deploys far more rapidly and comprehensively than other competitors’ monitoring systems.
GridObserver® comes with a single interface that displays the reports and status of the network that is being monitored. This interface is accessible online through any current web browser with proper login credentials. GridObserver®’s interface is the single pane of glass for all network elements that can be configured to display all the KPIs and LIT® that have been tailored to maximize operational effectiveness. From this interface, all elements of the monitored network are capable of being accessed.
GridObserver® integrates ticketing and alerting, providing a seamless means by which system failures and network issues may be addressed without being lost in the shuffle of different tracking systems. These ticketing and alerting settings function as a flagging mechanism for the system to know where system failures and network issues might be occurring. GridObserver®’s subatomic modeling permits timely detection and real-time escalation of pinpointed issues. Once notified of these issues GridObserver® will utilize its intelligent auto-notification to alert network operators.
On the primary dashboard of the interface, the customizable details of the network are displayed. GridObserver® is able to integrate multiple forms of notification, allowing for a tailored approach to each system that it is integrated into. It also allows an array of ways to receive important information regarding the network. This prevents any threats or problems from going unnoticed. This, in turn, escalates problems as they are discovered so they can be dealt with and resolved quickly.
With its integration with existing systems, GridObserver® has the ability to engage in Root Cause Analysis and Deep Failure Analysis. Once faults are detected, GridObserver® can escalate the issue in order to provide a timely remedy to the fault. There are multiple ways that a user on GridObserver® can custom tailor the notifications of alarms or reports coming through the NMS.
GridObserver® also tracks recurring events. Tracking these issues and escalating them according to their priority level enables management to see where these problems occur. This allows network managers to have the information required to determine the best course of action to fix the problem.

GridObserver®’s seamless integration permits access to anything connected to the system, which in turn is able to be monitored via GridObserver®’s user interface. Most NMSs discover equipment based on the manufacturer and model number. GridObserver® also discovers manufacturers and model numbers but also discovers what role that equipment performs in the network.
For example a Cisco layer 3 switch could function as a top of rack switch, or as a router in the network. GridObserver® discovers and understands the role this switch plays in the network and monitors it based on that role. This is all automatic in the discovery process and does not require manual intervention for every device.
Assets within the the network are geocoded on a map by GridObserver®. These asset maps overlaid with specific area reports, which in turn provides accurate data to facilitate deployment and maintenance of the network.
GridObserver® is also capable of integrating with other management systems. The integration of different systems happens through rapid integration so no time is lost in sharing information between existing systems and GridObserver®. This means rapid risk free deployment with immediate results. GridObserver® detects the existing relationships and systems in a given network and maps these using subatomic modeling, giving all levels of network management a clear view of the physical and virtual operations of a network.
Highlighted Features
- Real-time network health and performance monitoring
- Historical performance, usage, and anomaly information
- LIT: Leading Indicator Technology decreases downtime
- Failure and Anomaly frequency analysis
- Real-time virtual and physical connections maps within the network.
- KPIs and LIT® that have been tailored to maximize operational effectiveness
- Integrates ticketing and alerting
- Patent-pending Management Information Base (MIB) Browser tools
- Root Cause Analysis and Deep Failure Analysis
Initial Setup
Many network monitoring systems are never fully deployed because of the difficulty and time involved with installation and integration.GridObserver® aims to make deployment and initial configuration as quick and painless as possible. GridObserver® is delivered as a fully configured appliance so there are no messy software installation issues to deal with. Our network discovery process greatly reduces the time and effort involved with initial data entry and system set up. Our tools do most of the configuration and detection work. Thus, the system is up and running in a relatively short time. Since GridObserver® has no external clients or agents, once the appliance is in place you are ready to go. Out of the box GridObserver® is configured such that valuable and actionable information is available within minutes.
Geographic Performance Modeling (mapping)
- real-time mapping
- physical devices & virtual ones as well
Quick Look:
GridObserver®’s Industry Leading Network Operations Suite
- GridObserver® provides a single vantage point from which the whole network can be operated.
- Trouble ticketing and alerting are integrated in order to accelerate the resolution process and reducing potential downtime.
- GridObserver® utilizes intelligent auto-notification for real-time escalation of issues, resulting in smoother operation.
- Notifications are thoroughly integrated, allowing for various forms of notifications tailored to the recipient ranging from operators and engineers to executives.
- GridObserver® employs trending alarms and prioritization in order to streamline operations at all levels.
- Assets within the the network are geocoded on a map by GridObserver® that is overlaid with area reports, which in turn provides accurate data to facilitate deployment and maintenance of the network.
- Seamless integration of GridObserver® with other management systems. Utilizing subatomic modeling, GridObserver® is able to learn the role of these systems in the network and integrate those systems into its subatomic network model.
- GridObserver® rapidly integrates with other systems without compatibility issues typically inherent with introduction of new systems within a network.

